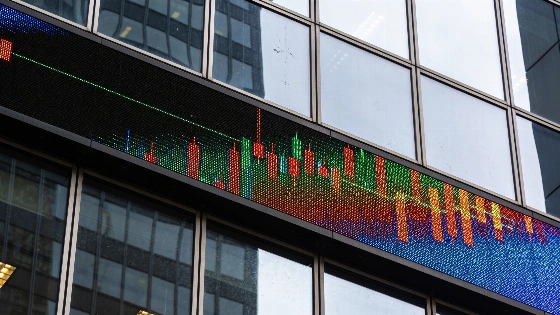
Key valuation metrics like the Buffett indicator and Shiller CAPE ratio suggest U.S. stocks are highly priced, but history shows bubbles can persist for years. Investors weighing defensive sectors may want to consider past crash performance
U.S. stock valuations have reached levels that many analysts associate with speculative bubbles, raising questions about how long the current bull market can last and what investors should do next. While warning signs are flashing, history shows that bubbles can persist far longer than most expect, making market timing a risky and often costly strategy.
Recent commentary from former Federal Reserve officials and prominent investors has drawn attention to several widely followed valuation measures. These metrics, while not predictive of short-term moves, offer context for understanding the risks and potential resilience of the current market environment.
Valuation Metrics Signal Caution
One of the most cited indicators is the so-called Buffett indicator, which compares the total market capitalization of U.S. stocks to the nation's gross domestic product (GDP). When this ratio exceeds 200, many analysts consider the market to be significantly overvalued. As of early 2026, the Buffett indicator stands near 238, a level rarely seen outside of major market peaks. Another key measure, the Shiller cyclically adjusted price-to-earnings (CAPE) ratio, compares the price of S&P 500 stocks to their average inflation-adjusted earnings over the past decade. The CAPE ratio is currently above 42, second only to the dot-com era peak in late 1999.
These elevated readings do not guarantee an imminent correction. In the late 1990s, for example, warnings about "irrational exuberance" were followed by several more years of strong gains before the eventual collapse. According to reporting by The Wall Street Journal, the Nasdaq Composite lost 78% from its peak during the dot-com bust, while the S&P 500 fell 49% from its high by October 2002.
Why Bubbles Can Persist
Speculative bubbles are often recognized only in hindsight, and even when valuation signals are clear, markets can continue to rise for years. Investor optimism, easy monetary policy, and the fear of missing out can all contribute to extended rallies. Predicting the exact moment when sentiment will shift is notoriously difficult, and attempts to time the top often result in missed gains or poorly timed exits.
For most investors, the challenge is not just identifying overvaluation, but deciding how to respond. Selling out of the market entirely can mean missing further upside, while ignoring risks can leave portfolios exposed to sharp declines. The persistence of bubbles underscores the importance of diversification and a disciplined approach to risk management.
Defensive Sectors and Portfolio Adjustments
While no strategy can eliminate risk, some sectors have historically weathered market downturns better than others. During the 2000-2002 bear market, energy, consumer staples, and utilities stocks delivered positive returns even as technology and growth sectors collapsed. These industries tend to offer more stable earnings and demand, making them attractive to investors seeking to reduce volatility in uncertain times.
As of March 2026, the S&P 500's forward price-to-earnings ratio remains above its 25-year average, and the index has posted a total return of over 12% annually since the pandemic lows of 2020, according to S&P Global. Yet, with interest rates stabilizing and economic growth moderating, many analysts expect more modest returns ahead and increased volatility, especially if earnings growth slows or inflation pressures persist.
Understanding the mechanics of valuation ratios can help investors interpret market signals more effectively. The Buffett indicator reflects the relationship between stock prices and the size of the real economy, while the Shiller CAPE smooths out short-term earnings swings to provide a longer-term perspective. Both measures have limitations-they do not account for changes in interest rates, sector composition, or global capital flows-but they remain useful tools for assessing broad market risk. Ultimately, while high valuations increase the risk of future losses, they do not dictate when or how a correction will unfold. Investors should weigh these signals alongside their own goals, time horizon, and risk tolerance when making portfolio decisions.