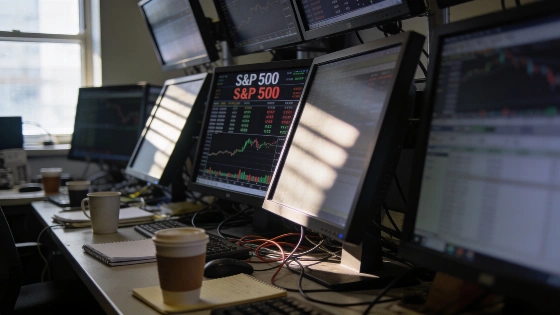
August is often a weak month for the S&P 500, with historical data showing average declines and increased volatility. Investors should expect normal pullbacks and review their portfolios rather than attempt to time the market
As the S&P 500 approaches record territory in mid-2026, investors are bracing for what has become a familiar seasonal pattern: August tends to bring turbulence. While the index's long-term trajectory has been upward, August and September have historically delivered the weakest average returns of any two-month stretch, with August's average performance hovering near zero since 1950. This seasonal softness is not destiny, but it does raise the odds of a temporary pullback, especially when sentiment is stretched and stocks have already rallied strongly earlier in the year.
For long-term investors, the key question is not whether volatility will appear, but how to respond when it does. History suggests that corrections in the 5% to 15% range are a routine part of equity investing-even in years when the market ultimately finishes higher. Rather than trying to predict the exact timing of a downturn, many financial professionals recommend using these periods to review portfolio allocations and prepare to buy quality stocks if prices retreat.
Seasonal Weakness and Market Corrections
August's reputation as a soft spot is supported by decades of market data. According to research on S&P 500 monthly returns since 1950, August and September stand out as the weakest months, with August's average return essentially flat and September averaging a slightly larger decline. Over the past 30 years, the S&P 500 has dropped about 0.5% on average in August, with September faring even worse at around a 0.7% average decline. These numbers highlight why investors often approach late summer with caution.
Yet, the scale of these pullbacks is typically moderate. Bank of America's analysis of seasonality since 1928 shows that the August-October period is the worst three-month stretch on average, but even in negative years, the typical correction is about 7%. That's uncomfortable, but well within the range of normal market behavior. In fact, a study of intra-year drawdowns since 1980 found that more than half of all years saw the S&P 500 fall by at least 10% at some point, with the average maximum drop around 13%-even in years that ended positive.
Midterm Election Years and Deeper Dips
This August is notable not just for its seasonal pattern, but also because it falls in a U.S. midterm election year. Historically, midterm years have brought even sharper volatility. Since 1950, the S&P 500 has averaged a peak-to-trough decline of about 18% during midterm years, with research from Carson indicating that these corrections often bottom in August. While this does not guarantee that this August will mark the low point, it does reinforce the statistical fragility of midterm summers.
Despite the turbulence, markets have often rebounded after the uncertainty of midterm elections passes. Studies of the presidential cycle show that the year following a midterm tends to deliver stronger returns, as policy clarity improves and investors shift focus back to fundamentals. For those with a long-term horizon, this pattern argues against making drastic changes in response to a seasonal dip.
Portfolio Strategies for Volatile Months
Rather than treating an August pullback as a signal to trade, investors may be better served by using it as a stress test for their financial plan. If a 5% to 15% decline would force a change in strategy or prompt a panic sale, it may be time to revisit asset allocation and risk tolerance. Reviewing sector exposures, trimming positions that have run ahead, and preparing a watch list of high-quality companies to buy on weakness can help turn volatility into opportunity.
It's also important to match investment time horizons to actual cash needs. Money needed in the next year or two is generally better kept out of equities, especially during historically weak periods. For those seeking more defensive positioning during market downturns, some investors look to dividend-focused funds, such as the Vanguard High Dividend Yield Index Fund ETF, which has shown smaller losses than the S&P 500 during past bouts of volatility, as discussed in this analysis of defensive fund strategies.
According to S&P Dow Jones Indices, the S&P 500 experienced an average intra-year decline of 14% between 1980 and 2025, yet finished higher in 32 out of those 46 years. This underscores that sizable drawdowns are a regular feature of the market, not a sign of systemic trouble. Investors who maintain discipline and avoid emotional reactions to seasonal volatility have historically been rewarded over time.
Understanding the difference between a correction and a bear market is crucial for investors. A correction is typically defined as a decline of 10% or more from a recent high, while a bear market involves a drop of 20% or more. Corrections are common and often short-lived, whereas bear markets are less frequent and usually tied to broader economic or financial shocks. Recognizing these distinctions can help investors avoid overreacting to normal market fluctuations and focus on long-term goals.