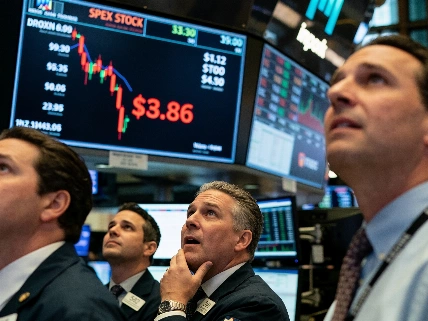
The S&P 500 has set more than two dozen record highs in 2026, while valuation measures have climbed to rare levels. Those readings point to risk, not a reliable date for a selloff.
On Sept. 22, the S&P 500 closed at 7,764.70, less than 0.5% below its Aug. 13 record, according to a Reuters market recap. The index has reached more than two dozen record highs in 2026 despite persistent inflation, global economic tension and warnings about artificial intelligence. That run does not remove the risk of a correction. High valuations do not provide a dependable countdown to one, either.
For investors, the practical question is not whether a downturn will eventually happen. It is whether a portfolio can withstand one without forcing a rushed decision. Selling because a crash seems near means getting two calls right: when to leave and when to return. History gives little reason to expect either call to be easy.
The Buffett indicator reached 240.24% in August 2026 and was around 235%-237% in September, well above the roughly 200% level Warren Buffett had described as 'playing with fire.'
Valuations point to risk
Two widely watched measures suggest U.S. stocks are unusually expensive compared with economic and earnings benchmarks. The Shiller CAPE ratio compares stock prices with inflation-adjusted earnings over the prior decade. On Sept. 21, 2026, it stood at 41.60. That was near its historical peak of 44.19 in December 1999 and well above its long-term average of about 17. A CAPE above 40 had occurred only in late 1999 before then. The 1929 peak was 32.6.
The Buffett indicator compares the total value of U.S. stocks with gross domestic product. In September 2026, it was around 235%-237%. It had reached 240.24% in August. Warren Buffett has previously warned that a reading near 200% could signal that investors are taking substantial risk. These measures describe valuations, not the next market move. They can identify stretched prices, but they cannot show when or how far prices might fall.
That distinction matters. A high CAPE ratio or Buffett indicator is not a sell signal with a known expiration date. Neither measure is a precise short-term forecasting tool. Both look backward, and unusually high readings can persist while markets keep rising.
Reuters identified 7,677.02, the S&P 500's September high, as a key level for bulls to break. A move above it could put the index back on course toward the area around 7,800.
Market timing has a cost
Recent history shows how recession warnings can fail as trading cues. In June 2023, Deutsche Bank analysts put the odds of a recession beginning within the next 12 months at nearly 100%. The yield curve was inverted, another traditional recession warning. Since then, the S&P 500 has risen more than 80%.
That gain does not prove the next downturn is far off or that the market will keep climbing. It does show the cost of treating a warning as a timetable. An investor who stopped contributing or sold holdings could have missed a substantial advance. The predicted decline did not arrive on schedule.
Valuation risk also differs across a portfolio. Investors weighing exposure to high-priced sectors can consider concentration alongside broader diversification. Related valuation coverage examines how diversified ETFs can help manage sector risk. That is a separate question from predicting the precise start of a bear market.
Time horizon changes the math
An investor who bought into the S&P 500 in January 2000 faced the dot-com bear market, then a long wait for a new record. The Great Recession began in 2007. Yet the source material reports total returns above 750% for that early-2000 investment by 2026. A painful entry point and multiple severe declines did not prevent a long holding period from producing a large cumulative return. That does not guarantee a similar result for future investors.
This history supports staying invested only when the plan fits the investor's circumstances. Money needed soon may not be able to withstand a deep stock-market decline. A long horizon may give an investor more time to recover, but it does not remove the risk of loss. Portfolio choices should reflect the investor's time horizon, ability to tolerate volatility and need for accessible cash. They should not rest on a guess about next month's market.
Valuation measures are a reason to examine risk, not a market-timing device. Stocks can fall from record levels, and the indicators show that current prices are rich by historical measures. They cannot establish when a downturn will begin. A disciplined long-term approach is more defensible than trying to exit and re-enter at exactly the right moments. That means holding investments with durable growth potential and avoiding abrupt decisions based on forecasts.