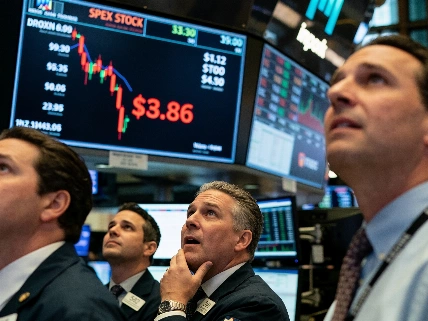
The S&P 500's Shiller CAPE has climbed above 40, a level last reached before the dot-com crash. The measure cannot time a downturn, but it can prompt investors to check their exposure before markets turn.
On September 28, the S&P 500 fell 0.8% but remained near record highs. Its valuation against long-term earnings tells a different part of the story. That is no forecast. A high reading means investors are paying more for each dollar of smoothed earnings, with less room for disappointment if expectations weaken.
For households with money in stocks or retirement accounts, the useful question is not whether the market will repeat the dot-com bust. No indicator can answer that. Ask instead whether a sharp drop would force a change in plans or a sale made under pressure.
In September 2026, the S&P 500 Shiller CAPE was reported at roughly 41.5-41.6, its second-highest level on record after the dot-com-era peak.
What the CAPE measures
Economist Robert Shiller developed the cyclically adjusted price-to-earnings ratio, usually called the Shiller CAPE or CAPE. It compares the S&P 500's current price with the average of its inflation-adjusted earnings over the previous 10 years. That decade-long measure smooths short-term swings that can make a conventional price-to-earnings ratio harder to read.
The current reading is above 40. The long-term average is about 22, though estimates often fall between 17 and 22 depending on the method and comparison period. The ratio was nearly 45 before the dot-com crash. It first rose above 40 in January 1999 and stayed there into 2000. As that bubble deflated, the ratio later fell to a little over 20. Past extremes show how far valuations have moved, but they do not prove the same decline lies ahead or say when one might start. A shorter-term measure tells another story: Reuters' valuation report said the S&P 500 was trading slightly below 19 times expected earnings, its lowest forward multiple since 2023.
The S&P 500 closed at 7,683.69 on September 28, down 0.8% for the day, according to Reuters. The index remained near record highs despite the day's decline.
The CAPE can fall if stock prices drop, if measured earnings rise, or if both happen. It describes the relationship between price and earnings. It does not predict a specific market move. A return toward the historical average could involve a substantial drop in prices, but the ratio cannot say whether or when that adjustment will happen.
Valuation is one risk
JPMorgan Chase CEO Jamie Dimon has described pressures shifting beneath the surface. He has pointed to geopolitical conflict, high debt, inflation and elevated asset prices. He has also warned that those pressures may remain manageable or could cause significant disruptions. The uncertainty matters: a high CAPE shows expensive valuations, not proof that a downturn's trigger has arrived.
Today's enthusiasm for artificial intelligence recalls the late-1990s technology boom, when investors were captivated by a transformative new technology. The comparison is a reason to examine expectations, not to assume today's companies or market will follow the same path. Similar readings do not make the two periods identical.
Valuation is only one kind of market risk. A look at leverage risks offers another view of how investors may be taking risk. The CAPE measures market prices against long-run earnings. Neither indicator can reliably identify a rally's peak. Warning signs together still cannot provide precise timing.
Plan for volatility
The CAPE reading is a prompt to check whether a portfolio fits an investor's ability and willingness to take losses. Someone who may need to sell stocks to cover near-term expenses faces a different risk from someone investing toward a distant goal with cash reserves. The time horizon matters. So do income needs and the amount of volatility a person can tolerate.
Investors might check how much of their portfolio sits in higher-risk holdings. That includes stocks that have benefited from AI enthusiasm. They can also review whether their overall allocation still fits their goals. Some may choose to build cash gradually or shift part of a portfolio toward consumer staples and utilities, sectors historically considered safer. These choices involve trade-offs. They are not universal prescriptions. Selling can change a portfolio's long-term exposure and may bring tax consequences in a taxable account.
The Shiller CAPE works best as a long-term valuation measure, not a countdown to a bear market. It cannot tell investors when to sell or how far prices might fall. The historical average is no guaranteed destination. Still, a reading above 40 against an average near 22 makes complacency hard to defend. Test the portfolio against a severe downturn now. Deliberate decisions are easier before a falling market puts investors under pressure.