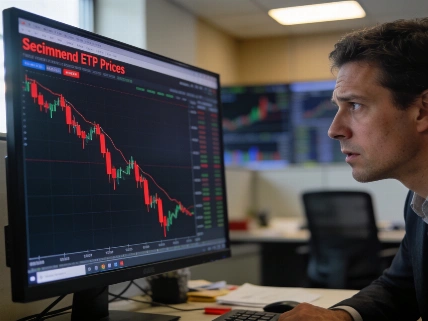
Over five years, $1,000 grew to $2,108 in QQQ and $1,892 in VOO. QQQ's higher fee and heavier technology concentration add risk for investors weighing growth against diversification.
QQQ held 102 positions, and its top 10 made up about 46.9% of its assets. Over the past five years, it also had a deeper maximum drawdown than VOO. VOO held far more stocks and showed lower historical volatility over the same comparison period.
The choice is not just about which fund performed better. Investors must decide whether they want broad exposure to large U.S. companies or a bigger bet on the Nasdaq-100's technology-heavy roster. That is the trade-off.
QQQ's top 10 holdings represented about 46.9% of its assets, underscoring that its 102 positions do not amount to broad diversification.
Fees and income favor VOO
As of September 29, 2026, VOO's expense ratio was 0.03%. QQQ's was 0.18%. Schwab lists the figures in its QQQ ETF report and VOO fund profile. On a $10,000 investment, VOO's fees work out to about $3 a year, compared with $18 for QQQ, before any change in investment value.
The dollar gap is small at that balance. But fees keep adding up; they are a recurring cost, not a one-time charge.
VOO also had the higher dividend yield, at 1.04% versus 0.42% for QQQ. Over the trailing 12 months, the funds paid $7.43 and $3.09 per share, respectively. Dividends can add to total return, but yield does not promise future income. A higher yield alone does not mean a fund will outperform.
The three largest publicly traded S&P 500 ETFs, including VOO, collectively managed nearly $2.7 trillion, Reuters reported. That figure highlights the scale of the passive-investing market.
VOO is the larger fund, with $1 trillion in assets under management. QQQ had $489 billion. On September 29, VOO shares cost $702.46 and QQQ shares cost $737.93. A higher share price alone does not make a fund more expensive or more valuable.
Growth comes with concentration
VOO tracks the S&P 500 and holds just over 500 stocks. Technology is its largest sector, at 39% of assets. Financial services account for 12%, and communication services make up 10%. QQQ tracks the Nasdaq-100 and holds 102 positions. Technology accounts for 59% of its assets, followed by communication services at 12% and consumer cyclical stocks at 11%.
Nvidia, Apple and Microsoft are among the largest holdings in both funds. Vanguard's published fund data also showed technology as VOO's largest sector in late August 2026. Information technology made up about 36.6% of its assets then.
QQQ led on returns over the reported periods. As of September 29, 2026, its one-year return was 24.2%, compared with 17.0% for VOO. Over five years, $1,000 invested in QQQ grew to $2,108. The same amount in VOO grew to $1,892. Both figures include total return. It may not continue.
Concentration cuts both ways. When one sector accounts for a large share of a portfolio, setbacks in that sector can hit the fund harder. QQQ's technology weighting makes it more sensitive to technology-stock moves than VOO, though VOO also has substantial technology exposure.
Risk changes the decision
QQQ's five-year monthly beta was 1.26, compared with 1.00 for VOO. Beta measures how a fund moved relative to the broader market over a set period. It is a historical measure, not a forecast.
QQQ's five-year maximum drawdown was 35.1%. VOO's was 24.5%. That means QQQ had the deeper peak-to-trough loss during that period.
For investors choosing a core holding, VOO's lower fee and wider spread of stocks make it the stronger default for broad exposure to large companies. QQQ is a deliberate growth tilt. It posted higher recent returns, but its narrower portfolio also had larger historical swings. A related growth-fund comparison examined a similar trade-off between technology exposure and diversification.
Total return combines changes in share price with distributions. Dividend yield measures income relative to share price, and it can change over time. Neither measure tells investors how much risk they can tolerate or when they might need the money. Past drawdowns show the losses investors experienced, not the maximum loss a fund could face. Based on the facts here, VOO is the more balanced core choice. QQQ may suit investors who knowingly want a heavier technology and growth position.