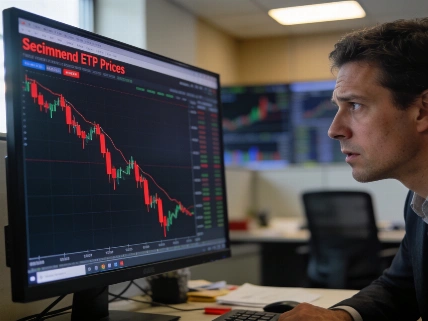
Stocks have often gained after midterm elections, with strong average returns across three quarters. The pattern may help long-term investors set expectations, but it cannot promise a rally or remove the risks of stock funds.
The fourth quarter of a midterm year has averaged a 6.6% gain for the S&P 500 since 1950. That history is worth noting. It is not a signal to rush into the market.
U.S. stocks rose in the 12 months after midterm elections about 95% of the time, according to Fidelity research. But past returns cannot tell investors when a downturn will start or whether stocks will rise again.
Time horizon and portfolio discipline matter more than the election calendar. Historical patterns can help set expectations. They cannot prevent losses.
In midterm years since 1950, October has averaged a 3.0% gain for the S&P 500 and finished higher 73.7% of the time. November has averaged a 2.7% gain and been positive in 78.9% of those years.
The post-midterm pattern
Carson Investment Research data covering 1950 through 2025 point to three strong quarters around the midterm-to-presidential-election cycle: the fourth quarter of the midterm year, then the first and second quarters of the next year. Its analysis of cycle-quarter returns found that Q4 averaged a 6.6% gain and finished higher 84.2% of the time. In the following first quarter, stocks gained an average of 7.4% and were positive 94.7% of the time. The second quarter averaged a 5.0% return and was positive 73.7% of the time.
Fidelity's longer measure looks at the 12 months after midterms. Since 1938, stocks gained during that period about 95% of the time. In a separate measure, the S&P 500 averaged a 14.5% return from November to November since 1950. These figures cover different periods and historical samples. Neither predicts what the next cycle will bring.
Carson's data rank October first and November second for S&P 500 returns in midterm years since 1950. Zacks' midterm-month analysis gives the monthly averages and the share of years with gains.
The results did not depend on which party won the White House or the midterms, or whether incumbents or challengers won. One possible explanation is that resolving some political uncertainty helps sentiment. The historical pattern alone does not prove that this drove returns.
Late-September 2026 market commentary frames the midterm 'sweet spot' as a seasonal pattern, not a causal explanation or a guarantee. Analysts point to historical calendar effects and potentially reduced political uncertainty, while noting that the pattern does not work identically in every cycle.
Politics is not a trade signal
Carson Group's historical data show different average market returns under different combinations of party control. Since 1951, the S&P 500 returned an average of 17% a year with a Democratic president and a split Congress. The average was 13.7% with a Republican president and a split Congress. Those figures describe past performance, not a forecast based on election results.
Investors also need to consider market conditions the election calendar does not capture. A valuation warning can still matter when seasonal data look favorable. Historical averages do not show when a correction might arrive or how deep it could be.
For people investing toward long-term goals, starting sooner and contributing regularly may matter more than trying to pick the ideal election-related entry point. Money needed soon should not go into stock funds. The same goes for emergency savings.
Build around broad exposure
Index exchange-traded funds offer broad exposure without requiring investors to pick individual stocks. A J.P. Morgan study covering 1980 to 2020 found that 66% of stocks underperformed the market and 42% had negative returns. The study found that a small group of major winners drove market-wide gains. As those companies' market values grow, they take up larger shares of market-cap-weighted indexes. According to the cited analysis, the S&P 500 outperformed 86% of actively managed large-cap funds over the past decade.
Two funds cited as possible core holdings are Vanguard S&P 500 ETF (VOO) and Invesco QQQ Trust (QQQ). VOO tracks the S&P 500 and has a 0.03% expense ratio. QQQ tracks the tech-heavy Nasdaq-100 and has a 0.18% expense ratio. Over the past decade, their reported average annual returns were 15.3% for VOO and 20.8% for QQQ. Those results are not forecasts. QQQ also has a different, more technology-heavy exposure than the broader S&P 500.
Dollar-cost averaging means investing set amounts at regular intervals instead of putting all the money in at once. It spreads purchases across changing prices. It does not prevent losses or guarantee a profit.
Market-cap weighting has a trade-off. Successful companies take up more space in an index, so gains in large winners can have a bigger effect on returns. The portfolio also becomes more exposed to those companies.
Treat midterm seasonality as context. It is not a reason to abandon a suitable long-term plan or use money needed for near-term obligations to buy stock funds.