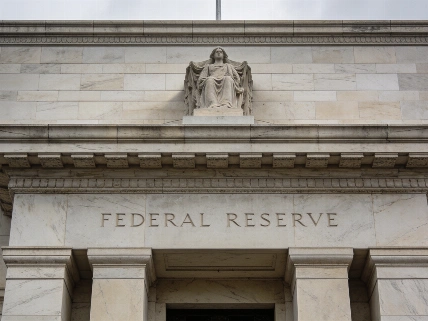
With futures markets assigning over a 90% probability to a Fed rate hike to 3.75-4%, investor attention turns to the central bank's updated dot plot and its first-ever 2029 projections for guidance on future policy direction.
Investors are preparing for a pivotal Federal Reserve decision, widely expected to deliver the first rate hike since July 2023. However, the primary market focus is on the Fed's updated dot plot, which, for the first time, will extend interest rate projections through 2029. With futures markets indicating more than a 90% probability of a quarter-point increase, attention has shifted from the rate move itself to the signals policymakers provide about the longer-term outlook.
As the Federal Open Market Committee readies its announcement, traders are closely analyzing available information to gauge how long higher rates may persist. The dot plot, which anonymously compiles each policymaker's forecast for future rates, serves as a key indicator of the Fed's internal consensus and range of views. This update is particularly notable for adding 2029 to the projection horizon, offering a longer-term perspective on where officials expect borrowing costs to settle.
According to a Reuters financial review, the Federal Reserve raised its target range for the federal funds rate by 25 basis points to 3.75%-4.00% on September 16, 2026, marking a key step in its ongoing tightening cycle.
Market Reactions and Sector Moves
Wednesday's trading session reflected the complex environment facing investors. The Nasdaq Composite rose 0.7% by early afternoon, while the S&P 500 edged up 0.3%. The Dow Jones Industrial Average was nearly unchanged, weighed down by significant declines in International Business Machines and American Express, which together subtracted 95 points from the index. Notably, IBM's decline occurred despite news of a $1 billion government contract, highlighting how broader macroeconomic sentiment can outweigh company-specific developments.
Energy stocks declined as U.S. crude oil prices fell more than 3% following a report of rising inventories. The United States Oil Fund dropped 3%, and major producers such as Chevron and ExxonMobil lost more than 2% each. In contrast, technology shares rebounded after several losing sessions, with Nvidia up 1.8% and Advanced Micro Devices gaining 3.8%. Space Exploration Technologies advanced 5.7%, supported by news of an upcoming Starship test flight and plans to deploy Starlink V3 satellites.
Ahead of the September decision, market participants assigned a 94% probability to a rate hike, driven by strong inflation data and expectations that the Fed would maintain higher rates for longer. Futures markets reflected this sentiment, with Fed funds futures showing over 80% probability of an increase after the latest CPI release.
Why the Dot Plot Matters
While the rate hike itself has been widely anticipated, the updated dot plot is where investors expect to find the most meaningful guidance. The dot plot aggregates each Fed official's individual forecast for the federal funds rate over the coming years, providing insight into both consensus and divergence within the committee. The inclusion of 2029 projections this round offers markets a rare look at policymakers' long-term expectations following a period of aggressive cuts and renewed tightening.
According to the latest analysis of the Fed's Summary of Economic Projections, the median forecast for the federal funds rate at the end of 2026 was raised to 4.1%. This suggests policymakers anticipate at least one additional rate hike in 2026 following the September move, and the new dot plot extends projections for the first time to 2029.
Long-Term Signals and Investor Strategy
The dot plot now shows median rate projections of 4.1% for 2027, 3.9% for 2028, and 3.6% for 2029, with the long-run rate estimated at 3.2%. This expanded forecast window provides investors with a clearer view of the Fed's long-term policy stance and the likelihood that rates may remain elevated for several years, as detailed in the latest SEP breakdown.
The market's focus on the dot plot reflects a broader search for clarity in an environment where short-term moves are often overshadowed by uncertainty about the Fed's ultimate policy trajectory. The committee's Summary of Economic Projections, released alongside the rate decision, will provide additional context on growth, inflation, and unemployment expectations. For investors, these projections can influence bond yields, equity valuations, and sector performance.
Recent market history demonstrates that significant moves in individual stocks can obscure underlying trends. For example, as reported earlier, rare dividend increases by companies like Nvidia have signaled confidence even in volatile conditions. However, as current trading shows, macroeconomic factors such as oil inventories and rate expectations can quickly alter sector leadership and investor sentiment.
For those monitoring the Fed's next steps, understanding the role of the dot plot is essential. The chart does not represent a binding plan, but it does reveal the range of views among policymakers and the degree of uncertainty about the future. Investors should recognize that while markets often react sharply to the Fed's immediate moves, the longer-term path of rates-and the economic forces influencing it-will ultimately shape the direction of stocks, bonds, and other assets. The dot plot is a tool for insight, not a guarantee, and its signals should be considered alongside broader economic data and individual financial objectives.