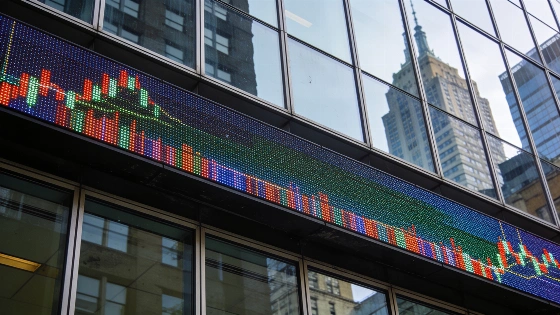
With the S&P 500 and Nasdaq at record highs and key valuation metrics flashing red, investors face mounting warnings of a potential market downturn-yet history suggests that staying invested may offer the best odds for long-term growth
U.S. stock markets have surged since late 2022, with the S&P 500 more than doubling from its October 2022 low and the Nasdaq Composite up even more. But as indexes reach new highs, several classic warning signs that preceded past crashes are now visible, raising questions about whether the current rally can last. For investors, the challenge is deciding how to respond to these signals without missing out on future gains.
Three major indicators-market valuation, debt levels, and bubble-like enthusiasm-are all at or near historic extremes. While these conditions have often come before sharp declines, history also shows that trying to time the market can backfire, especially for long-term investors.
Valuation Metrics at Extreme Levels
One of the most closely watched measures of overall market valuation is the so-called "Buffett indicator," which compares the total value of U.S. stocks to the nation's gross domestic product (GDP). This ratio has only exceeded 100% three times in recent decades: before the dot-com crash in 2000, ahead of the 2008 financial crisis, and now, when it stands above 200%. Such a high reading suggests that stocks are trading far above the size of the underlying economy, a pattern that has often preceded major corrections.
Another red flag is the Shiller CAPE ratio, which adjusts price-to-earnings for inflation and business cycles. The CAPE recently climbed above 40, a level seen only twice before-just before the 1929 crash and the late-1990s tech bubble. These valuation signals do not predict the exact timing of a downturn, but they highlight the risk that current prices may be unsustainable if earnings growth slows or investor sentiment shifts.
Debt and Leverage Risks
High levels of debt have played a role in past market collapses. In 1929, margin debt-money borrowed to buy stocks-hit record highs. Before the 2008 crisis, household debt soared as consumers and investors took on risky mortgages. Today, U.S. household debt reached a record $18.8 trillion in the first quarter of 2024, according to the Federal Reserve Bank of New York. At the same time, the private credit market is seeing a rise in defaults, adding to concerns about financial system stability.
Elevated debt can amplify losses if asset prices fall, as borrowers may be forced to sell quickly to cover obligations. This dynamic can turn a market correction into a broader economic problem, especially if lenders tighten credit or consumers cut back on spending.
Bubble Dynamics and Investor Behavior
Market bubbles are often only recognized in hindsight, but several features of the current environment resemble past episodes. The rapid rise in stocks tied to artificial intelligence and technology has fueled speculation that a new bubble may be forming. When bubbles burst, the trigger is often a shift in sentiment or a realization that growth expectations were unrealistic.
Despite these risks, history shows that investors who stay invested through downturns tend to recover and benefit from long-term market growth. According to research from The Motley Fool, the stock market often begins to rebound before the broader economy improves, meaning those who wait for clear signs of recovery may miss out on significant gains. For example, during the COVID-19 selloff in 2020, the S&P 500 dropped sharply but regained its losses within months and continued to climb. Investors who sold during the panic missed the subsequent rally.
For a deeper look at how long-term investing can pay off even after severe downturns, see this analysis of what happened to a $10,000 investment in the S&P 500 at the peak of the dot-com bubble: how patient investors fared after the tech crash.
Understanding Market Timing and Long-Term Strategy
While the temptation to exit the market during periods of high risk is understandable, evidence suggests that missing even a handful of the best recovery days can dramatically reduce long-term returns. The S&P 500's historical average annual return, including dividends, has been about 10% over the past century, but most of those gains come in short bursts following downturns. Investors who try to time the market often end up buying back in after prices have already rebounded, locking in losses and missing the strongest periods of growth.
Market timing is further complicated by the fact that warning signs can persist for years before a correction occurs. Elevated valuations and debt levels do not guarantee an imminent crash, and the market can continue to rise despite apparent risks. For most investors, maintaining a diversified portfolio and focusing on long-term goals remains the most reliable approach, even when short-term risks are elevated.
Valuation ratios like the Buffett indicator and Shiller CAPE are useful for understanding broad market conditions, but they are not precise timing tools. These metrics can remain elevated for extended periods, and their predictive power is limited by changes in interest rates, corporate profitability, and investor behavior. Investors should use them as part of a broader assessment of risk, rather than as a sole basis for major portfolio moves.