The investor looks for tech companies with fast revenue growth, rising margins and room to scale. Silicon Motion's recent results show the kind of growth that draws attention, but the approach still carries company-specific and market risks.
Silicon Motion reported $451 million in revenue in the second quarter of 2026. That was up 127% year over year and 32% from the previous quarter, according to MarketBeat's quarterly revenue figures.
Those results help explain why one investor looks beyond the biggest names in technology. The investor focuses on revenue growth, rising profitability and a company's room to expand. No filter guarantees gains.
Silicon Motion reported non-GAAP earnings per share of $2.43 for the second quarter of 2026, above the $2.13 consensus estimate.
Time changes the trade
The investor intends to hold each stock for at least five years, unless the company's fundamentals change substantially. A modest revenue dip in one earnings report would not automatically undo the thesis. Evidence that strong results were built on fraud would.
A short holding period leaves little time for a business to recover from a disappointing report or a market reaction that goes against the investor. The account describes purchases with a horizon of less than a year as closer to speculation. Macroeconomic shifts and company news can quickly push a position into negative territory.
A longer horizon does not prevent losses or make a weak company sound. It changes how time fits into the investment case. That is the distinction.
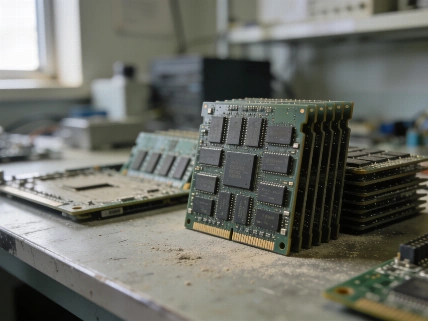
The investor cites Silicon Motion Technology (SIMO) as an example. The company operates in the memory market and has paired high revenue growth with improving profit margins. The investor opened the position with a multiyear thesis, not a plan to sell after a technical signal a few months later. That reasoning belongs to one investor. It does not show that the stock will deliver the expected return.
For the third quarter of 2026, Silicon Motion's revenue outlook was $519 million to $541 million, implying sequential growth of 15% to 20%.
Silicon Motion had previously forecast second-quarter revenue of $393 million to $411 million and an operating margin of 19.8% to 21.1%. Its reported net income reached $136.1 million, with a 30% profit margin, according to Simply Wall St's earnings review. The quarter was strong. Those figures alone do not show whether the company can keep up the same pace.
Tech concentration is a choice
The investor focuses on technology because they believe fast growth and expanding margins are easier to find in the sector. That is a concentrated approach, not broad diversification. A portfolio built around tech could take a harder hit if the sector's business conditions or market performance weaken.
The S&P 500 may also be less evenly spread across industries than its broad-market label suggests. In the figures cited in the account, technology stocks made up about 40% of the index's total value. Nvidia and Apple together accounted for more than 15%.
The top 10 holdings of the State Street SPDR S&P 500 ETF Trust were technology companies and represented almost 40% of the index. Advanced Micro Devices (AMD) was another technology holding near the top of the fund. The numbers point to a concentration that can be easy to miss.
The account also reports an 11% year-to-date gain for the ETF. Roughly one-third of S&P 500 companies outperformed that return, while almost half had negative returns for the period. Most index holdings that had doubled were technology companies or companies connected to artificial intelligence (AI), the account says.
The reporting period for these figures is not specified. They describe the account's snapshot, not current market performance. They also show why an S&P 500 fund does not necessarily hold equal amounts of every sector.
Why market cap matters
Market capitalization, the market value of a company's outstanding shares, is the final screen in this approach. The investor considers it after growth and business prospects. A smaller starting value needs a smaller absolute increase for a company's market cap to double.
That arithmetic can help frame a potential move. It does not show that a company can achieve it or that its shares are attractively valued. Not a forecast.
The account compares Nvidia at a $5.6 trillion market capitalization with Silicon Motion Technology at $9.5 billion. A doubling would take Nvidia to $11 trillion and Silicon Motion to $19 billion. Nvidia would need to add $5.6 trillion in market value; Silicon Motion would need to add $9.5 billion. The account describes the latter amount as about 579 times smaller.
Both companies had reported year-over-year revenue growth above 100% in their recent quarters, according to the account, despite Nvidia's much larger market share. The comparison helps show the difference in scale. It does not predict what either stock will do.
A market-cap analysis makes a similar point: the arithmetic can clarify what a large return would require, but it cannot predict that return.
The investor's focus on market-share gains follows the same logic. A move from 1% to 2% of a market doubles share. A move from 80% to 81% is a much smaller relative change.
Market-share growth may not turn into revenue, profit or shareholder returns. Fast growth and a modest market cap can make a company worth researching. They cannot replace a close look at its fundamentals or the risk that the thesis fails. A long horizon and growth criteria help assess uncertainty. They do not prove that a winner has already been found.